Dan Boland
Silicon Valley
In 2021, Private Equity acquisitions were funded at near-zero lending rates. Tight credit spreads fueled the issuance of new leveraged buyout (LBO) loans worth $146B, the highest since 2007.
But with the current macro backdrop of rising interest rates (notwithstanding a brief reprieve in June), Private Equity firms are dealing with the effects of the resultant cash crunch and longer hold periods. The cash crunch is directly linked to top-and-bottom-line pressures impacting cash balances of portfolio companies and their ability to service debt obligations. The longer hold periods are due to expected extended timeframes to create value in light of the high-entry multiples of recent years. This is evidenced by a slowdown in exit activity well below the pre-pandemic median from 2017 to 2019. In fact, quarterly exit value was down more than 75% at the end of Q1 2023 from its 2021 peak, according to PitchBook.
How can Private Equity investors improve the financial performance of their portfolio companies to address these issues and defend their portfolio value? Here are three contributing factors to the challenges investors face:
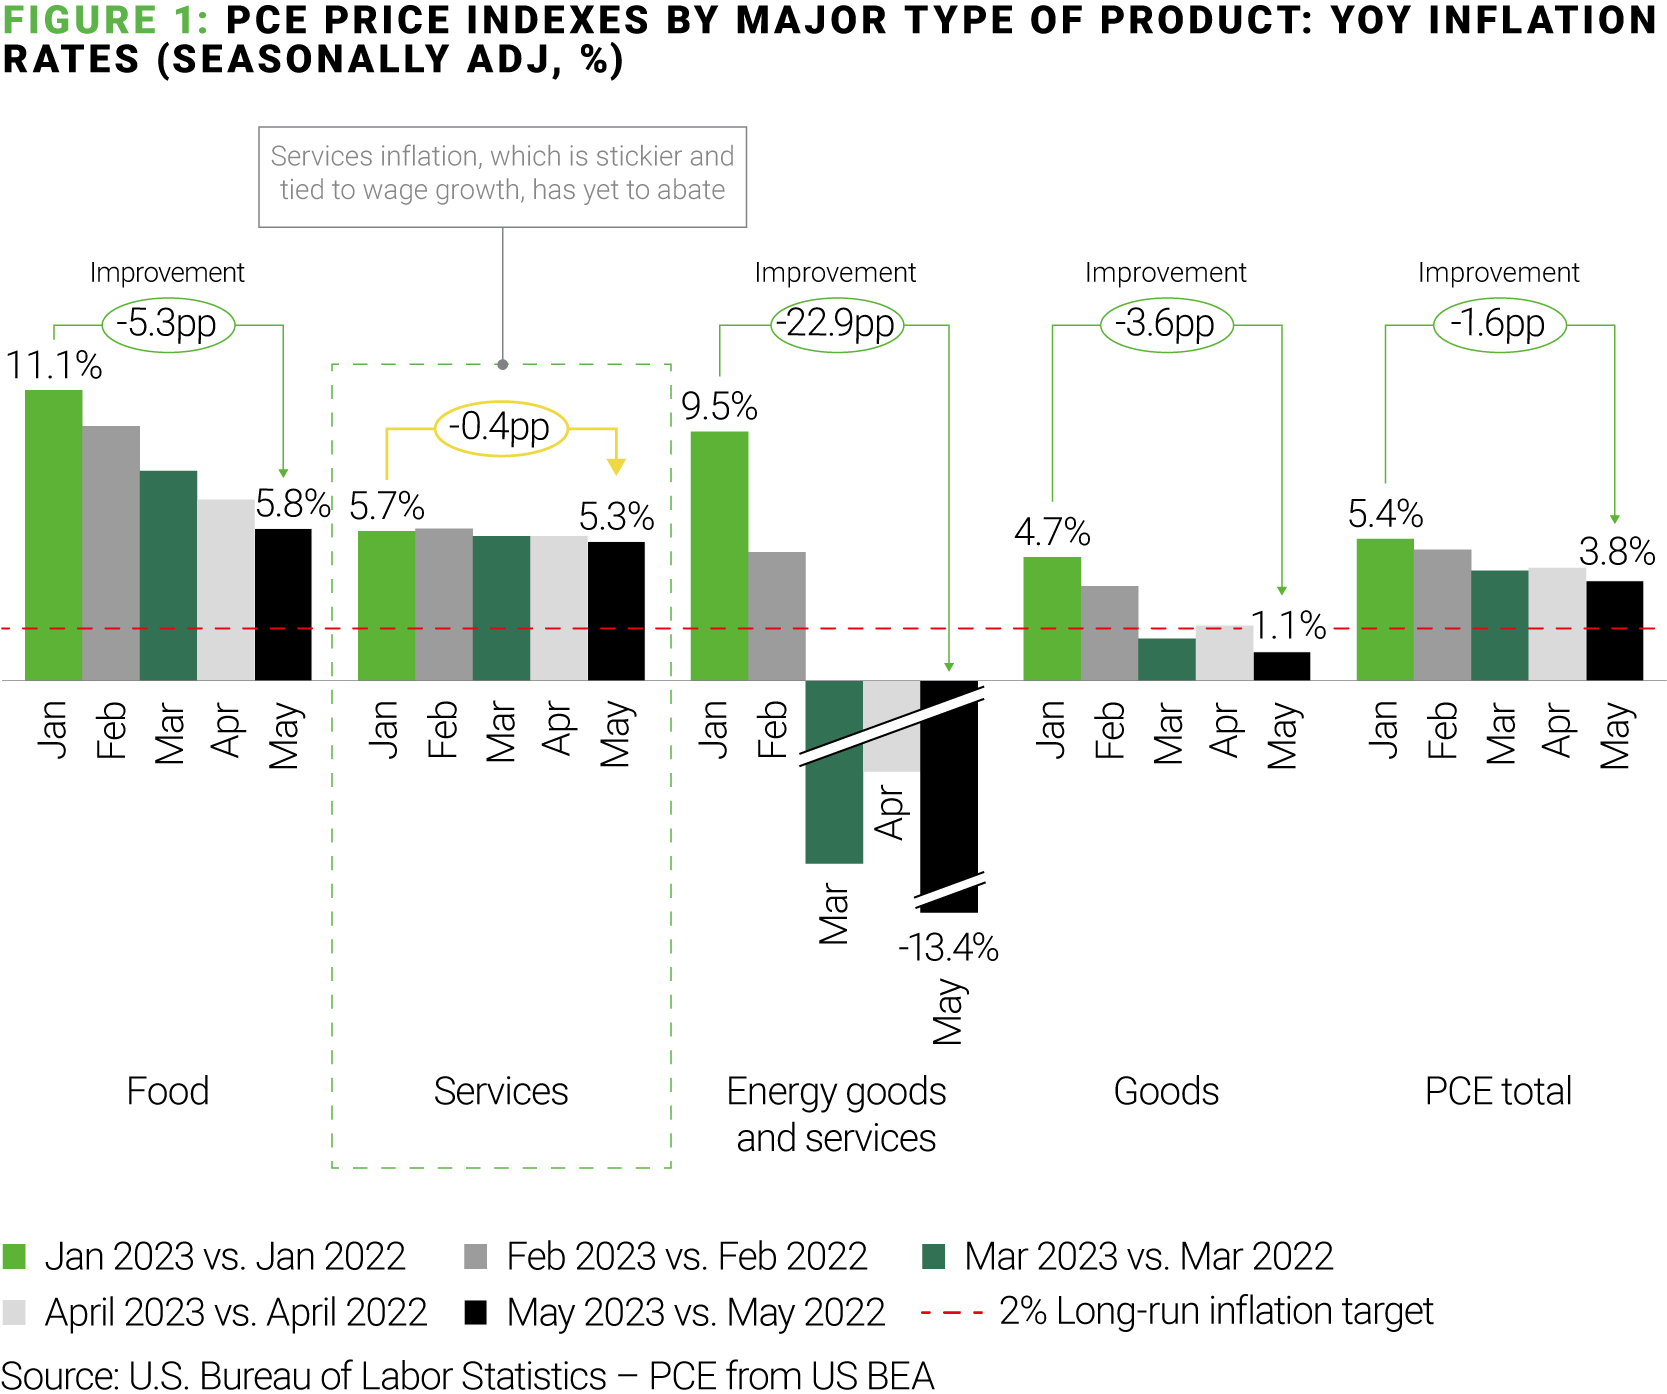
1. Inflation remains high, far from the Federal Reserve’s 2% long-term goal: On a 12-month basis, the core Personal-Consumption Expenditures (PCE) Price Index—the Fed’s preferred inflation measure—increased by 3.8% in May 2023 (see Figure 1), reflecting a slight deceleration from previous months. Goods and energy inflation have eased in the last few months primarily due to improved supply chains and oil production returning to normalized levels (especially in the U.S.), which has helped fill European supply gaps.
However, energy prices remain high compared to pre-COVID times and above-average summer temperatures will likely boost energy demand for cooling. While no one can predict when the Fed will change its stance on monetary policy, it seems likely that such a change in direction will not occur until inflation in services—which is stickier, tied to wage growth, and is the Fed’s current focus—abates.
In particular, while wage growth has slowed by 1.5% since a March 2022 peak of 5.9%, June 2023 wage growth of 4.4% remains higher than pre-pandemic levels, putting continued pressure on company cost structures. The cost impact is most pronounced for services and cyclical industries such as leisure, rental, and hospitality.
Figure 1: PCE Price Index by Major Type of Product: YoY Inflation Rates (seasonally adj., %)

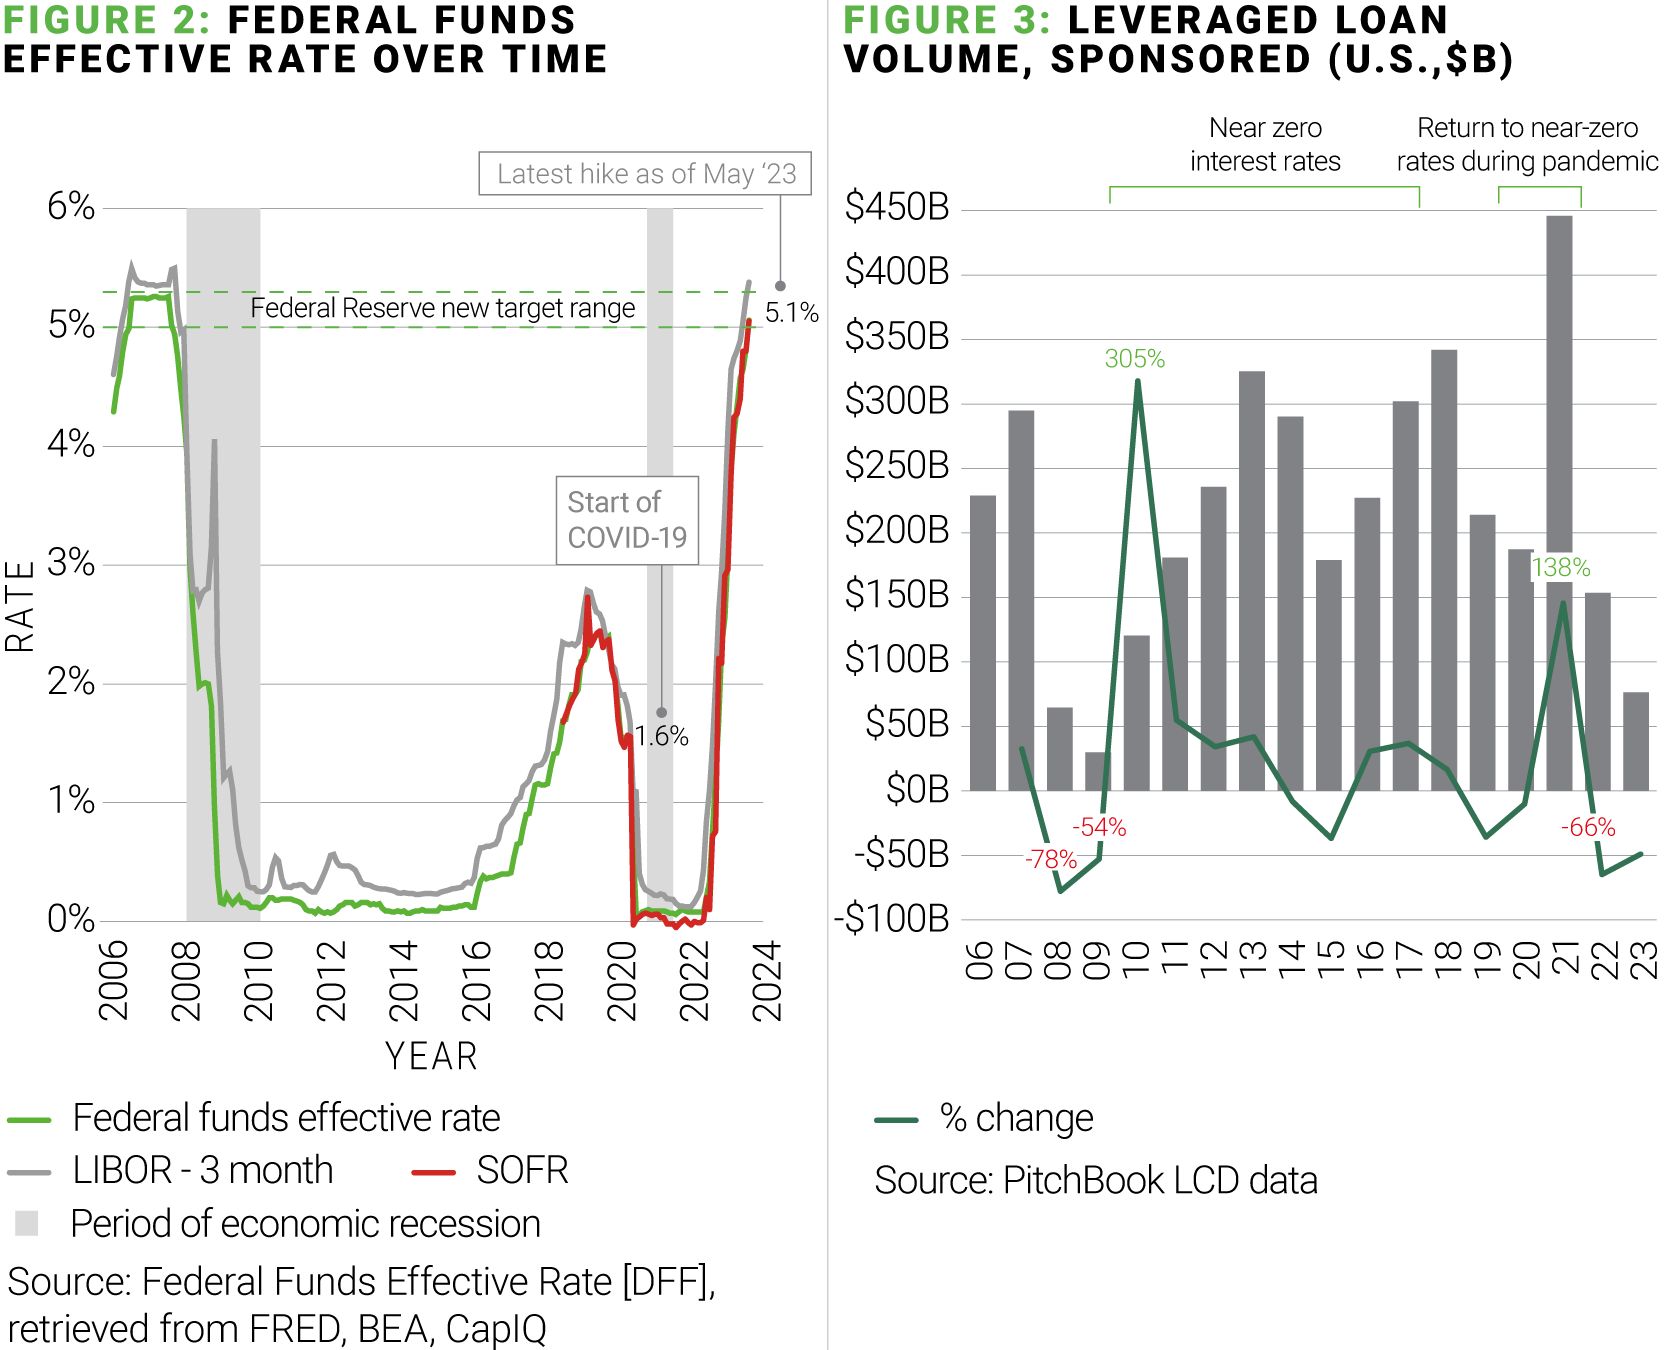
2. Interest rates continue to rise, impacting borrowing costs and the leveraged loan market: Following the end of the last major recession in 2009, the U.S. economy enjoyed a decade-plus of record-low interest rates (see Figure 2). When interest rates plunged to near-zero in 2020 at the start of the global pandemic, many Private Equity firms seized the opportunity to increase capital investments at a time when they were focused on expanding their portfolios.
But this period has now come to an end. Today, higher rates are putting sizable pressure on the floating-rate asset class. During May’s policy meeting, the Federal Reserve hinted towards two more rate hikes later this year, reaffirming expectations that elevated funding costs for leveraged loans are unlikely to ease any time soon. The leveraged loan market has reacted similarly to how it did during the last financial crisis. As interest rates began to rise in March 2022, sponsored leveraged loan volumes fell 66%, marking the biggest decline since 2008 to 2009 (see Figure 3). For U.S. loans funding buyouts, the Q1 2023 volume of $13.9B was lower than any year since 2010 as SOFR and LIBOR rates rose to 5%, in line with the Federal Reserve's hikes.

As the cost of debt rises (see Figure 4), a larger portion of earnings must be used to service higher debt payments. For example, consider an LBO transaction completed at lower spreads in 2021 at 6x EBITDA leverage and ~2.0x coverage ratio. With new-issue debt yields hovering around 11%, companies with the same level of leverage would see their coverage ratio fall to ~1.4x, potentially violating covenants tied to their debt (see Figure 4).
Figure 4: Impact of Average Cost of Debt on EBITDA coverage* (Source: PitchBook)

3. Companies are experiencing a slowdown in top-line growth: In 2022, S&P 500 companies reported revenue growth rates of 10.7%. But the latest FactSet projections predict revenue growth of 2.4% for 2023, translating to pronounced top-line slowdowns. For the first half of 2023, S&P 500 companies are reporting year-over-year revenue growth of 4%.
To illustrate the impact, let’s look at a 2021 Private Equity LBO of a software company with $1B in revenue expected over the next 12 months, 20% YoY net sales growth, and 20% EBITDA (thus achieving the Rule of 40, the notion that combined growth rate and profit margin should exceed 40% for high-performing tech companies).
Assuming 8x EBITDA leverage, the Private Equity firm raised $1.6B in debt at 5.5% interest during the previous low-interest rate environment. Over the subsequent two years, as we have described above, the assumptions that underpinned the initial deal thesis changed significantly. As Figure 5 depicts below, the deal thesis predicted a 2023 expected net income of $224M ($288M EBITDA less $64M interest expense). But in the new reality, this has fallen by 83% to $38M, severely impacting the long-term prospects of the acquisition.
Figure 5: Illustration of P&L for an LBO in 2021 vs 2023

At AlixPartners, we have recently assisted many of our Private Equity clients and their portfolio companies that are facing these macroeconomic headwinds, helping them to pivot from a near unconstrained focus on growth to a more prudent and efficient strategy balancing enterprise value sustainability (via maintained growth) and capital structure viability (via cost alignment, cash generation, and balance sheet management). We have seen successes in maintaining growth while driving efficiencies and yielding significant EBITDA improvements.
We have codified our approach with three questions that we help our clients answer in these situations:
1. How can you grow your top line in a down market?
What additional investments in product development and M&A could drive top-line growth?
Are you driving change in your go-to-market motion and aligning your organizational structure to support it?
How is your marketing budget allocated to aid specific growth initiatives?
What incentives can you implement to boost customer retention and loyalty?
Our colleagues recently wrote an HBR article highlighting these quick impact areas.
2. Can your organization improve its cost structure without negatively impacting its top line?
How can you optimize your team structure without significant disruption?
How can you drive balance between cost savings, efficiency, and quality while accelerating the offshoring and outsourcing of appropriate teams and functions?
What is your return-to-office strategy? Is your real estate strategy reflective?
When were contracts last negotiated with major suppliers? Does spend align with actual utilization and demand (e.g., with IT contracts)?
3. What additional measures could help preserve cash?
In a capital-constrained environment, what are the most critical investments that could redefine your investment thesis and exit strategy?
What measures could you proactively take to optimize working capital and better manage your cash position?
Which key factors most impact liquidity?
Do you have real-time visibility into systems and data sources to enable real-time decision making?
AlixPartners continues to work across an array of investor clients to navigate the abrupt change from an easy credit environment to a world of valuation pressure and credit tightness.
As market conditions deteriorate and the Fed “chases” inflation, investors must work to mitigate the risks outlined above. We are here to help by working quickly and decisively to identify best-case scenarios, streamline processes, find tactical and meaningful cost savings, and achieve optimized performance in this challenging environment.