
Jake Schoelles
Senior Vice President - New York

Manufacturers in need of extra capacity face a stark tradeoff. They can commit to slow, capital-intensive expansion, or they can unlock hidden capacity already sitting on their factory floors.
In capital‑intensive manufacturing, the default answer to capacity growth has long been simple: build more. But the economics and timing of that answer have shifted; construction costs have outpaced other inputs, and greenfield projects still take years to ship the first unit. At the same time, many existing plants are not operating at peak—they sit on latent structural capacity constrained by a handful of rate‑limiting steps.
Bottleneck analysis is about finding and converting that hidden capacity into reliable throughput, so leaders can grow faster and at lower risk by making more with what they already have before committing to their next major build. Through a bottleneck analysis, it is possible to identify key points of substantial capacity unlock for minimal capital investment.
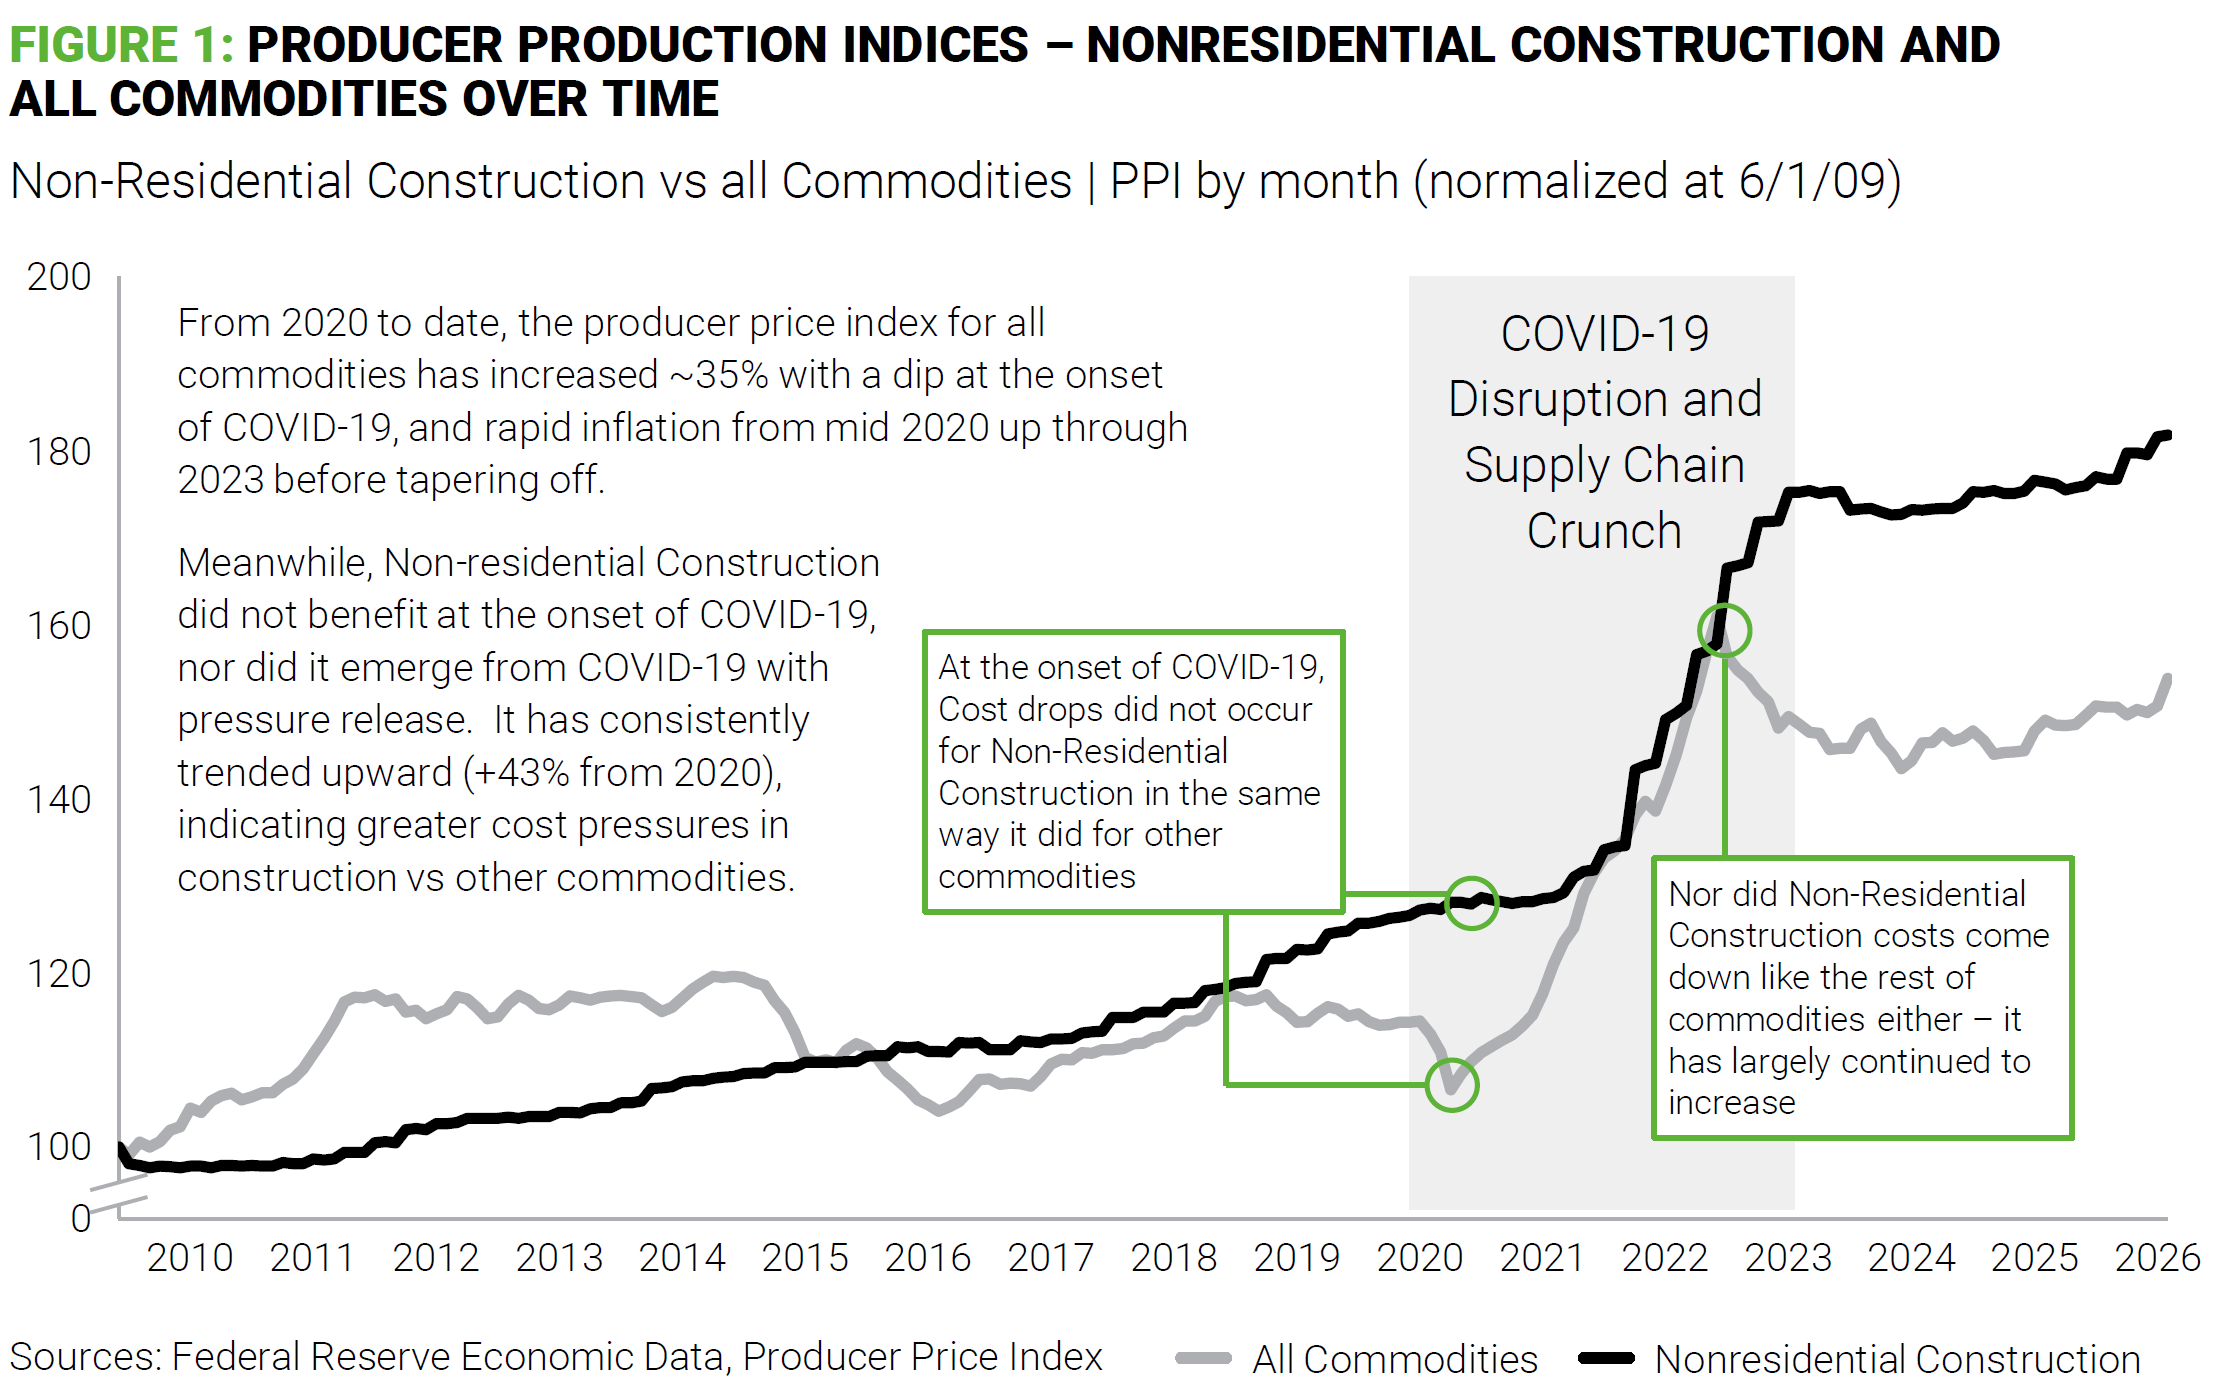
Since 2020, nonresidential construction costs have risen roughly 43% and have outpaced the broader commodity basket by nearly eight percentage points. Unlike costs for other inputs, these never came back down. When commodity prices spiked and then partially retreated, construction costs rose and held. The cost to buy a unit of new plant capacity through steel, concrete, and MEP systems is now structurally higher than it was five years ago and unlikely to decline.
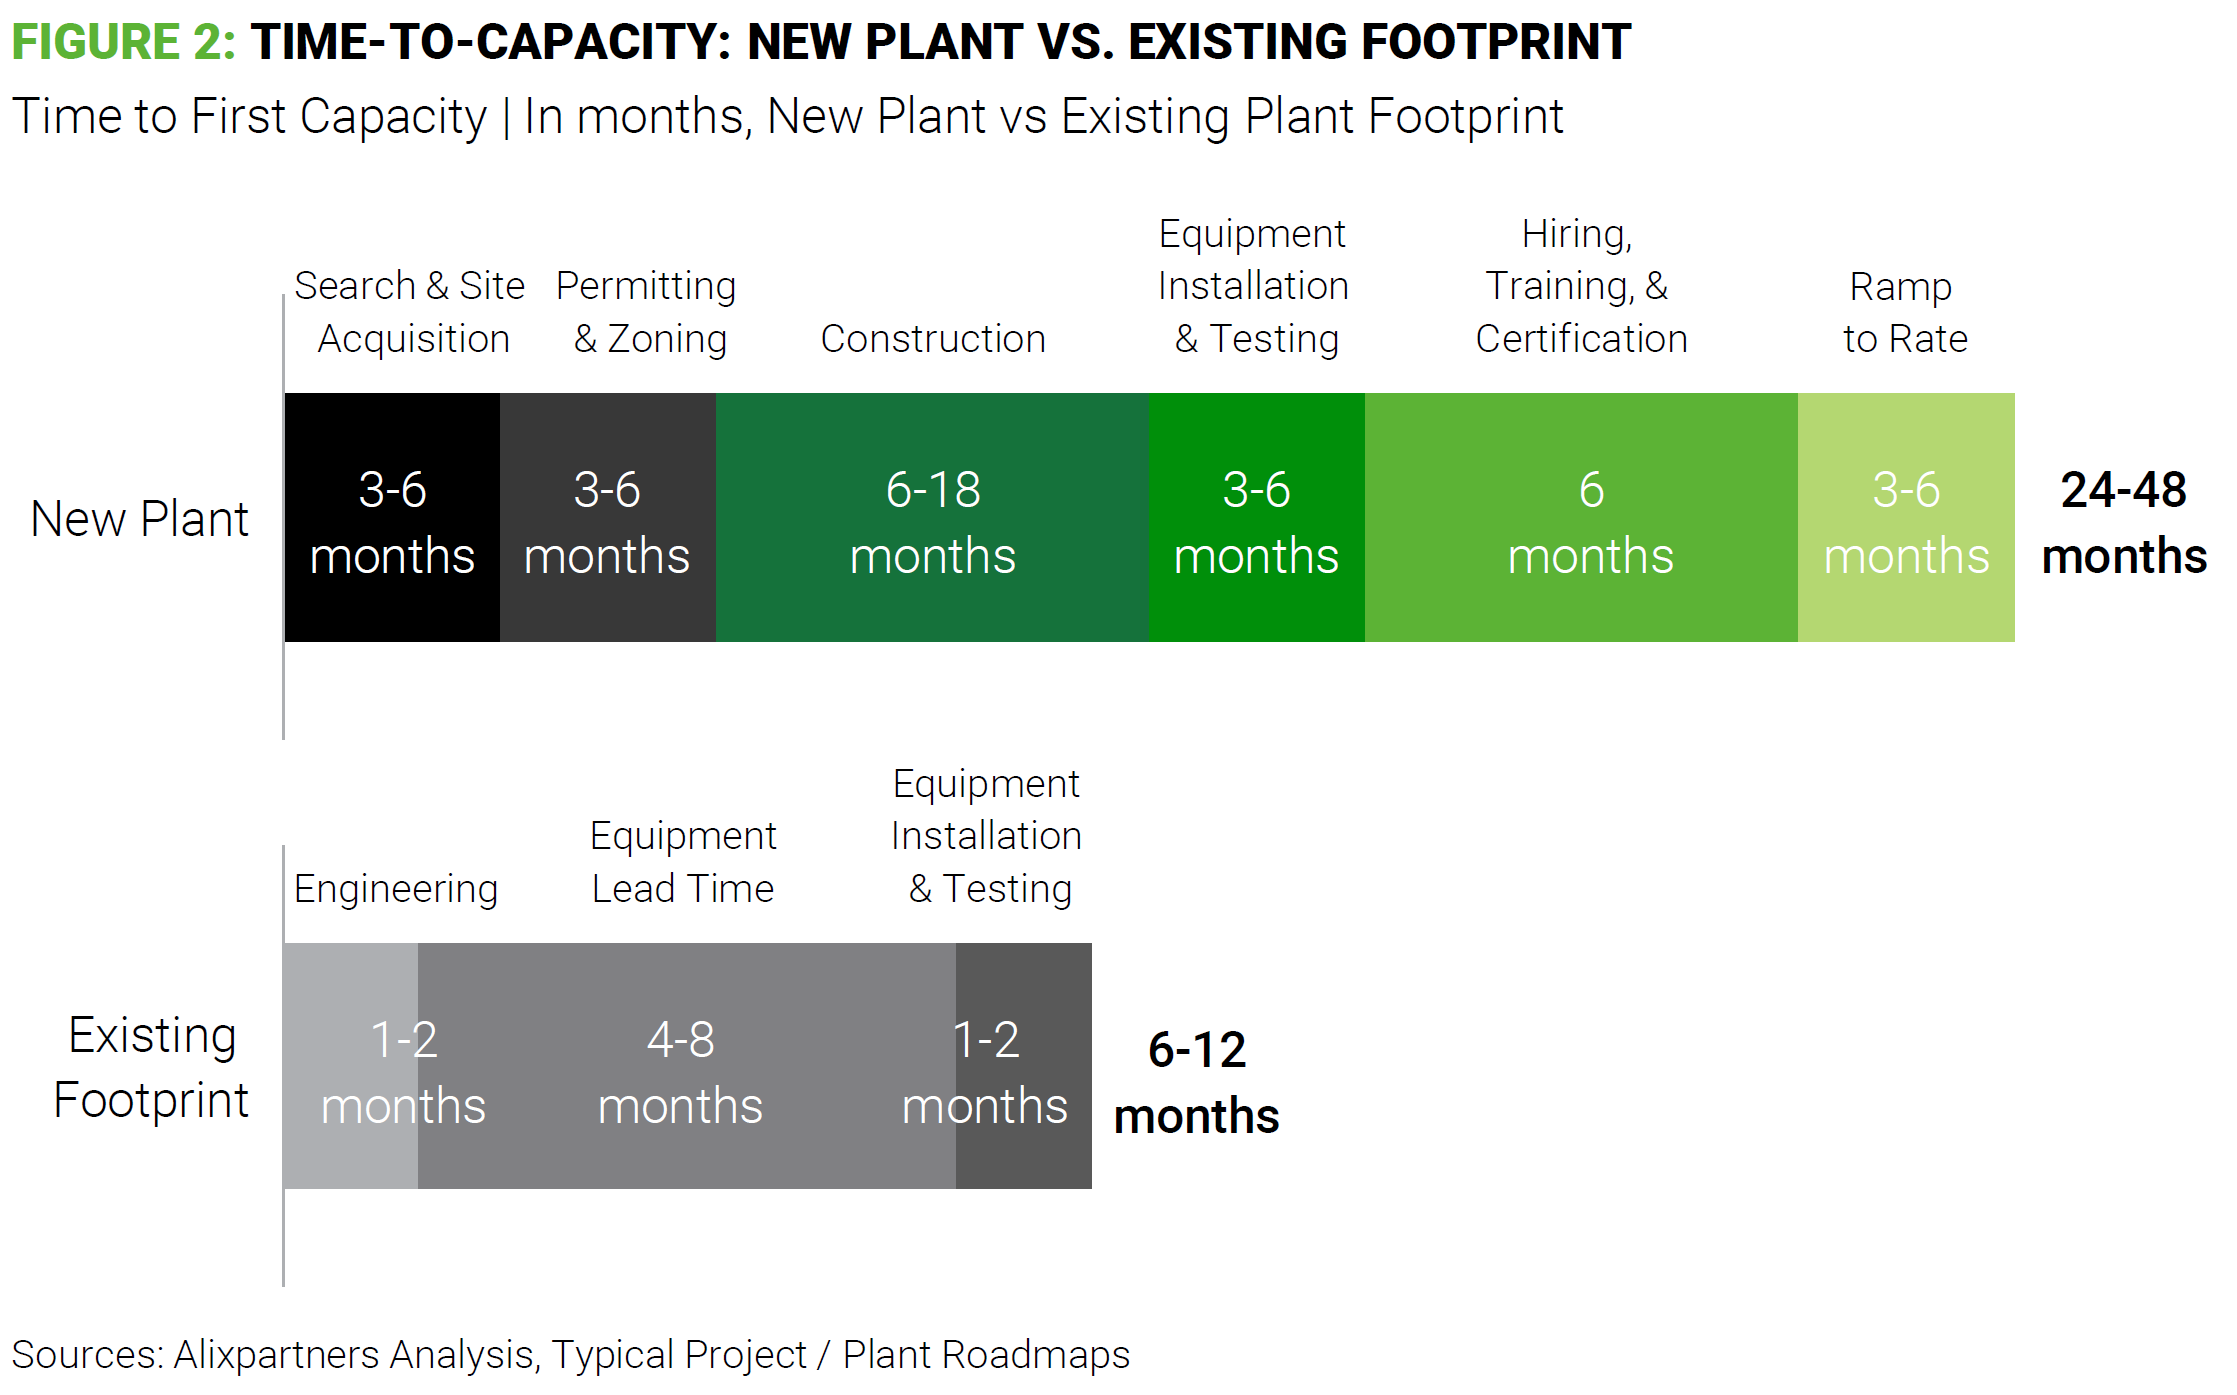
Timelines matter. No matter how well the project is planned, delays happen, driving up costs. It could be permitting, equipment lead times, or workforce availability, taking the initial timeframe to well beyond the expected 24 to 48 months.
Projects within an existing footprint operate on a different clock. Individual debottlenecking projects can take six to twelve months to complete. More importantly, projects can run in parallel, allowing the manufacturer to add meaningful capacity across multiple constraints simultaneously rather than waiting for a single large project to finish.
The vastly differing timelines of these two scenarios create a strategic decision. In a demand environment where speed and volume are critical, the cost of the additional capacity is as important as when it arrives.
Upon close inspection, many plants are not operating at capacity. A line that is "at capacity" is rarely at capacity for every step. In a world where lines are partially upgraded on an as-needed basis, a few specific unit operations may be constraining it: the heat-treat stage that sets the ceiling on throughput, the filling center that paces everything downstream, the conveyance system that consistently starves the next asset in sequence. The rest of the line is often waiting on a single choke point.
This results in a facility that, on the surface, appears to face capacity issues. Instead, it is experiencing localized constraints that can be solved with targeted investment rather than new capacity.
In large, automated manufacturing environments, it’s not uncommon for the gap between perceived capacity and the system's actual potential to be 5-10%+ higher than current production. That is not a rounding error. On a plant running significant volume, it represents real tons, real cases, and real revenue that are within reach of your existing buildings, utilities, and infrastructure.
Bottleneck analysis is a structured, engineering-driven process for identifying and overcoming the true rate-limiting steps in a manufacturing system, in order to determine the actual potential capacity of the line. It focuses on performance (the sustainable run rate of the line) and isolates the constraints that determine what the system can produce on its best realistic day when staffed, supplied, and running to standard. The analysis not only identifies the bottleneck, but it enables the high-level solutioning, costing, and quantification benefits for each individual bottleneck, and creates a first round pass of business cases, prioritized based on ROI.
Bottleneck analysis is not just another efficiency initiative. While downtime reduction, maintenance, labor productivity, and changeover improvements all matter, they don’t raise the system ceiling if the core constraint remains unchanged. Without addressing the true bottleneck, these efforts deliver incremental gains but eventually plateau—leaving structural capacity untapped.
Further, the true potential of a line is often not well understood or calculated. OEM ratings and original design specifications become less and less the reality as equipment degrades, and partial, ad hoc upgrades are made to the line. This creates gaps between actual, expected, and potential performance that usually aren’t fully tracked over time. The process of bottleneck analysis uses actual data to stack demonstrated performance against the true theoretical performance of the line to close these knowledge gaps and gives a picture of the true potential – as well as what it takes to get there, and how to do it.
Once you know there is more capacity hiding in the system, the next step is to measure it rigorously and build a plan to move the ceiling. An accurate assessment of the manufacturing system starts with the people on the shop floor who know it best. Operators know which processes cause the biggest headaches and trigger the most maintenance calls, and supervisors can reveal how things really work rather than what process sheets say. Their lived experience—where the line falls apart, which machines are “touchy,” and how actual changeovers differ from the process sheets—is critical context for identifying the real constraints.
From there, the focus shifts to structure and data—mapping the full process and using production data, on-floor testing, and direct observation to validate insights, quantify performance, and identify the true bottleneck.
This results in a clear view of which unit operations are production choke points. And with a set of constraints to tackle, an understanding of realistic outage windows and capex envelopes, you can develop a bespoke, strategic portfolio of debottlenecking projects, containing a sequenced set of capital investment proposals tied to specific constraints.
The output is a clear, ranked view of which operations structurally limit system performance — and what it would cost, and take, to change each one.
The economics of bottleneck investment are fundamentally different from those of new construction. When capital is concentrated at the true rate‑limiting step, every dollar works harder: it is not spread across equipment that already runs well or spent on redundant infrastructure, but used to buy throughput that the rest of the system is ready to deliver and cannot reach because one constraint is in the way. As noted earlier, in large, automated facilities that rigorously run this analysis, it is common to unlock 5–10%+ additional system throughput at a materially lower incremental cost per unit than a new build, because that capital rides on existing buildings, utilities, and process infrastructure.
How you sequence that capital matters as much as the economics. A first wave of projects can often add 5–7% capacity within about 12 months, with a second wave following as demand warrants, turning a single, indivisible greenfield commitment into a series of smaller, high‑confidence bets, each validated before the next is funded. Beyond just capacity expansion, there is a second return that rarely appears in the initial CapEx case: flexibility. Relieving structural bottlenecks also often allows plants to run more SKUs, tolerate more frequent changeovers, or shift volume across formats with less sacrifice to total throughput—benefits that, in volatile demand environments, can be worth as much as the raw tonnage.
Taken together, those economics and flexibility benefits are meaningful—but they are not equally valuable in every setting. We’ve found that bottleneck analysis is most powerful in environments with the following characteristics:
Bottleneck analysis turns the tables on these scenarios, leading to a more nuanced discussion and a more effective approach to identifying untapped capacity.
In a world where construction costs are structurally higher, timelines for new capacity are still measured in years, and most plants carry untapped structural capacity, it is more rational to test how far your existing footprint can go before committing to new bricks and mortar. The manufacturers who move first on latent capacity will be better positioned on cost, on speed, and on options than those who undertake a greenfield project.
The analysis required to identify and size your bottlenecks is not a lengthy or disruptive undertaking. It begins with a focused diagnostic: a structured look at your highest-volume, most-constrained assets, combining plant-floor observation with operational data to establish where your system ceiling actually sits and what is holding it there.
That diagnostic produces a clear answer to a question most leadership teams have only estimated: how much additional capacity exists in the network, and what would it take to reach it?
If you are weighing capacity investments to gain capacity, that is the right question to answer first.