
Visualize your entire workforce to drive fully informed, impactful transformations
Radial identifies faster routes to value creation by combining entire workforce visualizations with our deep transformation experience. With Radial, you can quickly create a current state picture of any organization and identify actionable insights to improve that structure.
Rapid answers to complex reorganization questions
Are we set-up to deliver our corporate strategy or respond to market conditions?
Should our teams be centralized or decentralized?
Are we working well along reporting lines?
Is our management structure right?
Get to informed insights with Radial: visualize your entire workforce at a granular level of detail – uploading, mapping, and validating FTE-data in minutes. Combine that with our deep transformation experience to create real-time simulations of the value potential in reorganization actions – for one organization or multiple entities:
- Elevate team effectiveness
- Streamline functions to reduce expenses
- Improve operations to raise per-FTE revenue
- Build scalable foundations for sustainable growth
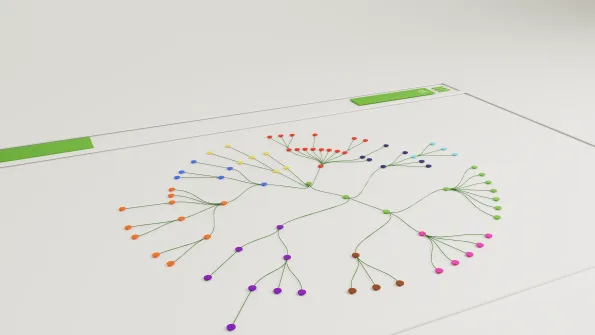
Visualize and analyze
Analyze an organizational structure in hours, not weeks – bringing together internal and external data.
- View, group, and modify employee and contractor information
- Understand time allocation and activity frequency
Identify and question fragmented activities
Find answers to critical questions on costs, headcount, and efficiency.
- Which functions have high labor costs or inefficient structures?
- Why are headcount figures out of alignment?
- How would activity consolidation look? How much would it save?
Collaborate on value creation ideas
Explore and discuss options and ideas in real time. Simulate, pressure test, and re-cast.
- What would the impact of centralized or decentralized teams be?
- What about alternating reporting lines and management structures?
- Can corporate strategy alignment be improved?
- Are we set-up to respond to market conditions?
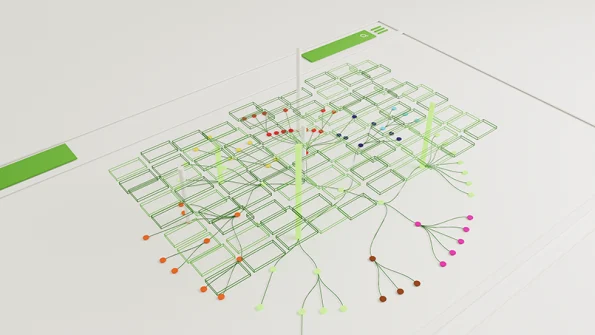
Open-up more potential: pinpoint productivity gaps and compare performance
Locate productivity potential
Unprecedented visibility into workforce dynamics: act on role entanglement and optimize performance
- Process census information in a secure Service and Organization Controls 2 environment
- Use machine learning to map worker roles, functions, and sub-functions
- Expose productivity pain points created by activity duplication, fragmentation, and shadow organizations
- Open-up new potential through visualization, moving instantly to expert guidance on key actions needed to optimize workloads
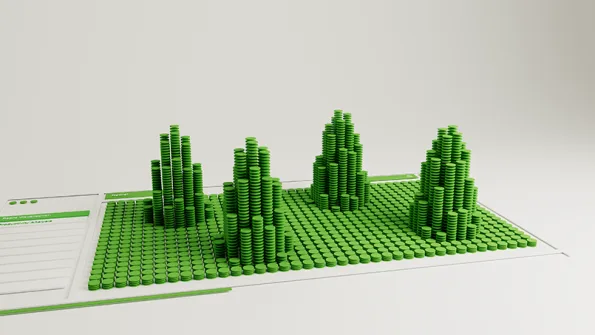
Compare performance
Compare company functions and departments against similar organizations
- Use activity and census data to compare performance and structures today
- Identify differences down to individual FTE level
- Set target levels across organizational, operational, and financial metrics
- Unlock deep insight to inform your approach
Our track record:
Sales Organization Right-Sizing
Improved sales productivity and drove delayering and simplification in the APAC region of a $50+B tech company
From: Slow market responsiveness with inconsistent coverage models and suboptimal productivity across the APJ sales region (with up to 7 reporting layers)
To: A smaller, more nimble team, with best-in-class coverage designs and a maximum of 5 layers
APJ leader P&L costs: ↓ 8%
Span: ↑ 23%
Gross margin/sales cost: ↑ 6%
Marketing transformation
Redesigned marketing organization’s model to reduce internal duplication, friction, and increase proximity to the business
From: Significant duplication across activities and frequent political battles leading to delayed actions and decisions
To: A right-sized central marketing team serving local needs with greater efficiency
P&L costs: ↓ 16%
Marketing FTE in Central organization: ↓ 66%
Go-to-market optimization
Optimized and simplified the North America Go to Market Sales Model to improve efficiency and productivity
From: An overly complex sales organization consisting of stacked resources and overlapping territories, with up to 30+ sales reps per territory
To: A fit-to-fight sales force, delayered from 6 to 5 layers with tighter management and higher sales productivity.
P&L costs: ↓ 7%
Span: ↑ 18%
Gross margin/Sales cost: ↑ 21%
“You did in two days what we and two other consulting firms could not do in six months.”