
Jerry Wang
Partner & Managing Director - New York

The operating environment within Medicare Advantage has become increasingly more challenging since we provided guidance in 2024 on navigating the post-COVID risk landscape. The market has shifted from rapid, capital-fueled expansion to a harsher reality marked by higher interest rates, evolving regulatory policy, and constrained revenue growth for primary care providers focused on Medicare Advantage.
Inflationary pressures on labor and supplies continue. These are compounded by limited benchmark increases (based on analysis of the unfinalized CMS 2027 advance rate notice) and full implementation of v28 risk-adjustment changes. Moreover, Star program dynamics and anticipated unlinked chart review changes could compress premiums, anticipated surpluses, and risk adjustment.
Our client work shows that these trends require renewed focus on liquidity, cash flow management, and operational efficiency to sustain financial and clinical performance. Utilization among Medicare beneficiaries also remains elevated relative to pre-COVID levels, further amplifying underlying volatility within the Medicare Advantage model. Under partial or full risk arrangements, primary care providers are typically paid a set per-member, per-month (PMPM) amount. They may earn a surplus if total medical expenses remain below the premium collected or, increasingly, absorb losses when costs exceed it.
Earlier in the cycle, robust growth rates, generous reimbursement, and ample capital helped mask structural weaknesses in panel density, clinic productivity, and overhead efficiency. With the prospect of flat effective rates and tighter risk adjustment, those weaknesses now translate into margin compression, rising deficit positions, and closer scrutiny from payors and investors alike.
For organizations pursuing more integrated, cost-effective care, financial performance depends on a complex mix of factors: medical loss ratio (MLR), risk-adjustment factor (RAF), contracting approach, and the overall clinical and corporate operating model. Each directly influences the patient journey and the provider’s ability to manage conditions proactively and avoid costly deterioration, benefiting patients and operators.
We examine six critical areas that Medicare Advantage operators should prioritize to strengthen sustainability and operational resilience.
Figure 1: Addressing key levers in the VBC models can help improve patient outcomes while reducing total cost-to-serve.
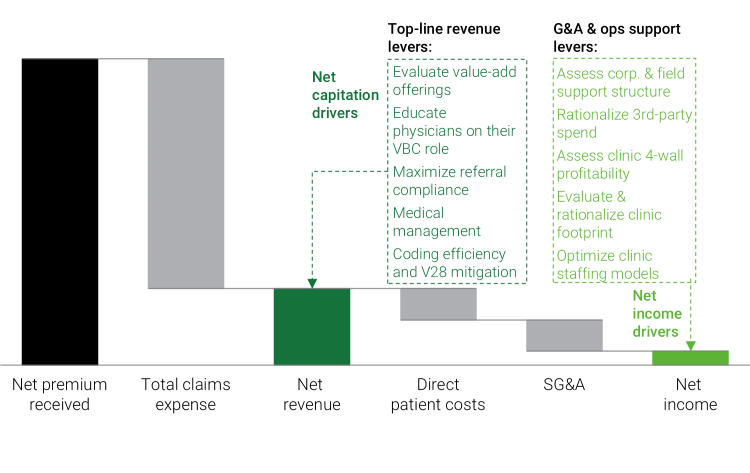
Rapid expansion of clinic networks during a period of strong cash inflows can lead to clinical capacity outpacing member growth. Underutilization can contribute to expense structures that outpace revenue.
Optimizing the clinic footprint can improve EBITDA even if there is some revenue loss. This is about finding the sweet spot: Identifying a number of clinics that are the right size, with the correct staffing model in place, and in locations that align to organization growth targets, will lead to better EBITDA margins than a large portfolio with suboptimal cost structures and low member count per center.
Ensuring clinical-level P&Ls are complete down to EBITDA with site-level MLR and complete cost structures - including direct and allocated expenses - is crucial to crafting the correct go-forward portfolio.
Acquisitions should allow networks to realize the benefits of shared corporate functions, yet poor integration often limits profitability and constrains growth. To capture these benefits, organizations must evaluate selling, general, and administrative (SG&A) expenses across core functions such as finance and accounting, IT, legal, and human resources, alongside clinical and operational shared services. Equally important is the use of technology enablement, including AI and automation, to simplify workflows, strengthen decision-making, and unlock efficiencies across the enterprise.
For example, implementing automated medical records intake software can improve both accuracy and efficiency in collecting, organizing, and processing incoming patient records, while also reducing manual administrative burden and accelerating turnaround times for clinical and operational teams.
Providers need to evaluate their partial or full-risk models to understand how the revenue is attributed between the two and how deficits are calculated. Armed with the underlying economics, they build a sustainable revenue base. Strategic contract exits should also be considered if the arrangement's economic trajectory is unsustainable. This can pose organizational risk and should be planned with both patient impact and financial ramifications at the forefront of the decision process.
For example, understanding the nuances of the provider's share of surplus or deficit from risk-corridor arrangements will help them better understand how their actions and decisions affect the bottom line.
The healthcare industry is no stranger to CMS regulatory changes, with the V28 model reshaping the risk landscape by remapping ICD‑10 codes, consolidating categories, and recalibrating coefficients to generally lower average RAF scores even when the underlying patient condition is unchanged. At the same time, CMS has proposed excluding diagnoses from unlinked chart review records from MA risk‑score calculations beginning in 2027.
This creates a situation in which diagnoses captured only through retrospective chart reviews and not tied to a specific, accepted encounter will no longer count toward risk adjustment.
Minimizing the impact of V28 and unlinked charts requires a combined offset and execution strategy: quantifying expected RAF declines by cohort and building them into multi‑year plans in addition to shifting effort from retrospective, unlinked chart review toward accurate and compliant capture of conditions during clinical encounters.
Value-based care (VBC) should work for patients and healthcare networks alike. Medicare Advantage organizations must focus on streamlining clinical services to assist providers in giving panoramic care to patients.
Aligning with providers on revenue cycle management (RCM) functions means being proactive in outreach to clinicians to assist them with coding current and future practices. A system in balance sees care management functions aligned with the goal of keeping the patient out of high-cost-of-care environments. That means a more proactive approach to high-risk patient groups, with more outreach and touchpoints.
Physician bonuses and incentive structures also reinforce the goal of VBC and the mission of risk-based MA organizations.
For example, measuring a physician’s generic dispense rate (GDR) or referral compliance with preferred & in-network specialists will help incentivize behavior aligned with the VBC model and drive lower overall cost of care.
Companies should build a rolling 13-week cash flow forecast tightly linked to receipts, with detailed underlying information on membership, risk pool performance, and payor settlement timing.
This should be augmented with explicit scenarios to stress test plans with declining surplus, plans shifting to deficit positions, and overall delays in plan cash flows. Other steps include: disciplined balance sheet management or carefully sequencing clinic rationalizations and SG&A reductions to free up cash, negotiating more favorable payment terms with payors and vendors, and setting clear internal guardrails for operation through periods of minimum cash and revolver and/or funding availability.
For sponsor-backed or leveraged platforms, proactive engagement with lenders around covenants and liquidity triggers, supported by a credible cost reduction and revenue stabilization plan, can create room to execute operational fixes before a liquidity crisis forces value destructive actions.
Boards and management teams should align on a simple escalation framework: what happens, and when, if risk pools underperform plan? Capital structure optimization, restructuring, or asset sale options can then be evaluated while there is still time to act.
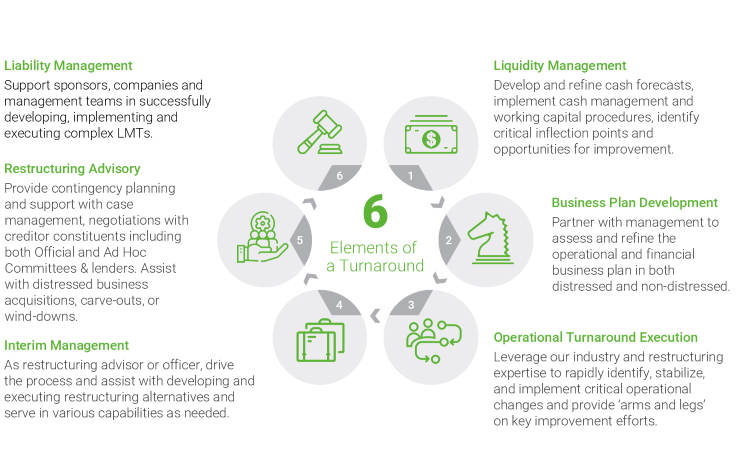
Figure 2: Six elements of a turnaround
For a deeper dive on the opportunities and challenges of Medicare Advantage operators, contact the authors.